|
|

 CURRENTLY RUNNING
|
|
|
Datamining the NSA - Part I
|
 |
Page
1
2
3
4
5
6
Next
|
|
Selected graphics
Generating nice and meaningful graphs from the results is a time consuming task. We will add more graphs soon.
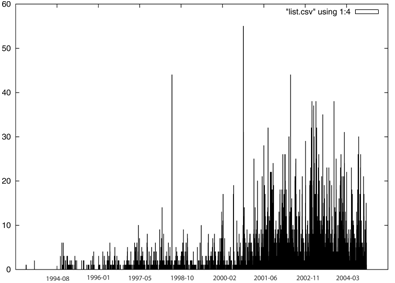
List use
The real growth of the list started a few months before 9-11. The two highest peaks in the graph were produced by poorly configurated "out-of-office" autoreply agents. As
Content Analysis
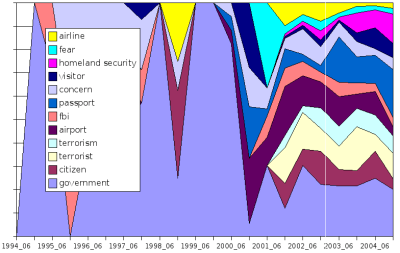
Using adaptive and learnable text learing algorithms, we've made several attempts to content analysis. The graph below shows the posting topics splitted by general topics, organisations and targets.
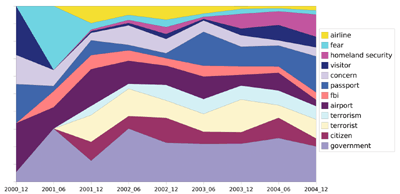
After 9-11 a list got a new spin. For example see as the topic "fbi" gets lost in favour of the term "homeland security". Before that noone dared to connect biometrics with terrorism and hardly noone connected it with braoad usage in public life.
Closeup of the time after 2000
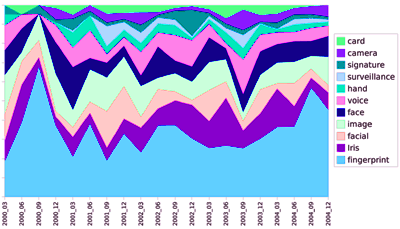
The following shows disussed biometric technologies: Fingerprints are still dominant technology, allthough there are hights and lows. card based security seams to vanish in favour of just body based distinguishing marks.
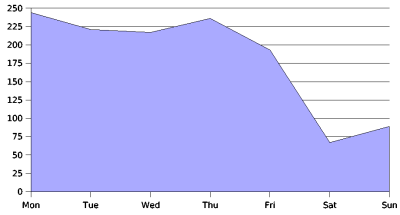
Example: User analysis
Is a person a private or cooperate user? The posting time histogram gives us a hint, there are of course more sophisticated questions around. E.g. which mailservers are being used by which time of the day etc. This is of special interest if postings of the same person come from environments of
|
|
| Page 1 2 3
4
5 6 Next
|
|
|
< < alle aktuellen kampaigns anzeigen
|
|
|
|
|


